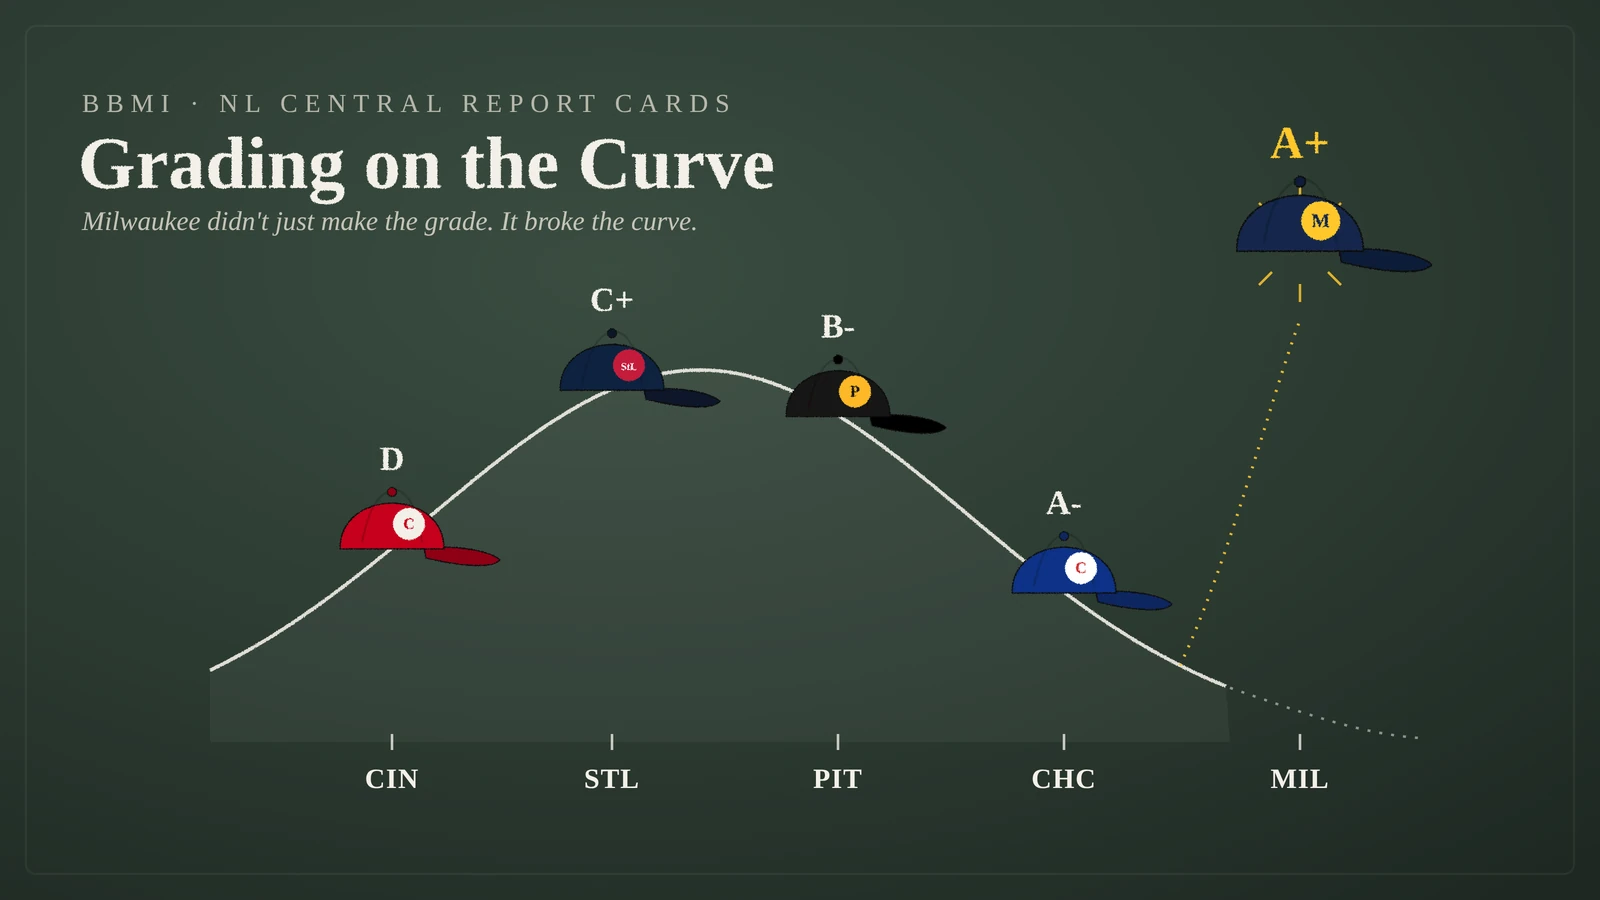
Grading the NL Central: Milwaukee Has Broken the Curve
BBMI grades every team’s season, roster, front office and manager.
The standings tell us which teams have won the most games. They do not necessarily tell us which organizations have done the best work.
An expensive team with an elite roster is supposed to win. That is generally why teams acquire expensive, elite players rather than assembling the roster through a neighborhood raffle.
A lower-payroll club producing the same record may deserve considerably more credit. A manager can do excellent work with a mediocre roster, while another can underachieve despite having enough talent to make the lineup card largely self-explanatory.
Same division, five very different report cards.
That is the idea behind these NL Central report cards.
Each organization receives four grades:
Overall team grade: Current record, BBMI ranking, playoff probability, World Series appearance probability and full-strength talent.
Players/roster grade: The underlying quality of the roster and what its individual players have produced, using BBMI talent, scoring margin, offense and pitching as the broader framework.
Front-office grade: The quality and results created relative to payroll, along with roster construction, depth and organizational direction.
Manager grade: Actual winning percentage relative to BBMI's record-neutral talent rating, adjusted for scoring margin, injuries, roster limitations and player development.
The overall grade is not a simple average of the other three. A rebuilding team can be competently managed and sensibly constructed while still being, in the technical baseball terminology, not especially good.
The manager grade begins with the difference between actual winning percentage and BBMI's full-strength talent estimate. That difference should not be interpreted as literal “manager-added wins.” Injuries, sequencing, unexpected breakouts and the occasional baseball bouncing off something it was not designed to bounce off also matter.
BBMI's talent rating estimates the underlying quality of a fully healthy roster without simply rewarding teams for games they have already won. BBMI's postseason probabilities come from an internal methodology that simulates the remainder of the season 10,000 times and plays through the complete postseason bracket in every simulation.
The team-level data below uses BBMI's July 27 power rankings and July 28 postseason simulation.
NL Central grade book
| Team | Record | Win % | BBMI rank | Talent | Win % minus talent | Playoff | Win division | Reach World Series | Adjusted payroll |
|---|---|---|---|---|---|---|---|---|---|
| Milwaukee Brewers | 66–40 | .623 | 2nd | .562 | +.061 | 99% | 96% | 28.0% | $135.7M · 19th |
| Chicago Cubs | 60–46 | .566 | 6th | .520 | +.046 | 95% | 4% | 5.4% | $233.3M · 8th |
| Pittsburgh Pirates | 55–52 | .514 | 10th | .527 | −.013 | 33% | 1% | 2.2% | $102.0M · 23rd |
| St. Louis Cardinals | 53–53 | .500 | 21st | .452 | +.048 | 13% | 1% | 0.6% | $94.6M · 27th |
| Cincinnati Reds | 49–55 | .471 | 24th | .449 | +.022 | 1% | 1% | 0.1% | $134.5M · 20th |
BBMI’s World Series figure is the share of simulations in which a team reaches the World Series, not its probability of winning it. Payroll figures are Spotrac’s 2026 adjusted payrolls, ranked 1–30 across MLB.
Milwaukee Brewers
At some point, outperforming expectations stops being surprising and becomes an organizational skill.
Milwaukee is 66–40, second in BBMI's rankings and projected to finish 97–65. BBMI's simulations give the Brewers a 99% probability of reaching the playoffs, a 96% probability of winning the NL Central and a 28% chance of reaching the World Series.
Only the Dodgers rank above them. Unlike the Dodgers, Milwaukee has apparently decided that constructing an elite baseball team does not require the gross domestic product of a small country.
That comparison is less exaggerated than it sounds. Los Angeles' projected competitive-balance-tax payroll is roughly $413 million, exceeding the Marshall Islands' latest reported annual GDP of $308 million by more than $100 million. The Marshall Islands, in fairness, have yet to develop a reliable third starter.
Players/roster grade: A
The Brewers' roster grade starts with Jacob Misiorowski, who treats normal pitching statistics as a concern for pitchers with less interesting fastballs.
Misiorowski has a 1.58 ERA, 185 strikeouts in 120 innings, a 0.75 WHIP and a .149 opponent batting average. He has been less a starting pitcher than a recurring administrative problem for opposing lineups. Kyle Harrison has added a 3.01 ERA, while Trevor Megill has converted 17 saves with a 2.97 ERA.
The lineup does not depend on one superstar. Jake Bauers has 18 home runs and an .856 OPS. Brice Turang has 15 homers, 15 steals and an .820 OPS. Jackson Chourio is batting .277 with 13 home runs and 10 stolen bases, while Andrew Vaughn has produced an .882 OPS in 171 at-bats. Rookie Cooper Pratt has reached base at a .361 rate.
There are enough imperfections to prevent an A+. Christian Yelich has a .714 OPS, and Sal Frelick has slipped to .631, with top prospect Luis Lara now getting a look in the outfield. Third base has been unsettled too, with David Hamilton, Joey Ortiz, Luis Rengifo and others cycling through the position before Rengifo was optioned, and no one has clearly claimed the job. Milwaukee is not receiving career-best production from every recognizable name. It simply keeps finding someone else to produce, which has proved nearly as effective.
BBMI assigns Milwaukee a .562 full-strength talent rating, the best in the division, while the club is winning at a .623 rate. The individual performances explain why the roster is excellent. The remaining difference helps explain the A+ grades awarded to the front office and manager.
Front-office grade: A+
Matt Arnold has produced the clearest A+ in the division.
Milwaukee's adjusted payroll is approximately $135.7 million, 19th in MLB. The Brewers are spending almost $98 million less than the Cubs and only about $1.2 million more than Cincinnati. Yet Milwaukee ranks second in BBMI, Chicago ranks sixth and Cincinnati ranks 24th.
There are subtle differences between those outcomes.
Low payroll by itself is not an accomplishment. A cheap roster with little talent is merely cheap. Milwaukee earns the A+ because Arnold's baseball operations group has paired a middle-of-the-pack payroll with elite talent, depth and championship-level results.
The Brewers continue to find useful major-league players, develop young talent and replace expensive production without enduring the traditional three-to-five-year period in which fans are asked to appreciate the process.
That is not thrift. It is efficiency.
Manager grade: A+
Pat Murphy's club owns the largest positive record-versus-talent gap in the division.
Milwaukee's .623 winning percentage is .061 higher than its .562 talent rating. That difference is supported by an elite scoring margin, strengthening the argument that the Brewers have consistently played above an already-high baseline.
Murphy has managed a young roster while maintaining Milwaukee's aggressive, irritatingly persistent identity.
No manager should receive sole credit for a team exceeding its talent estimate. But when the record, scoring margin, player development and organizational continuity all point in the same direction, it becomes difficult to argue that the manager is merely standing near the dugout railing while good things happen.
Verdict: Milwaukee has the division's best record, best underlying performance, highest playoff probability and best World Series outlook. It is accomplishing all of that without anything close to the division's highest payroll.
The curve has been broken. The other teams should speak with the professor.
Moneyball 2, starring Matt Arnold and Pat Murphy, coming to theaters in 2027.
Chicago Cubs
The Cubs are having an excellent season. No one outside Chicago is talking much about it because Milwaukee has inconveniently selected the same year to become nearly unbeatable.
Chicago is 60–46, sixth in BBMI and projected to finish 89–73. The Cubs reach the postseason in 95% of BBMI's simulations, although their probability of catching Milwaukee in the division is only 4%.
That makes Chicago a highly probable playoff team and a highly improbable division champion. Both statements can be true, which is one of baseball's less inspiring mathematical achievements.
Players/roster grade: A-
Pete Crow-Armstrong has become the player around whom Chicago's season revolves.
Crow-Armstrong is batting .288 with a .388 on-base percentage, a .540 slugging percentage and a .928 OPS. He has added 23 home runs, six triples and 26 stolen bases while playing elite center-field defense.
Seiya Suzuki has contributed 18 homers and an .824 OPS, while Michael Busch has reached base at a .364 rate. The lineup's depth has allowed Chicago to remain productive despite Alex Bregman's .705 OPS and Dansby Swanson's .710. Ian Happ's .218 batting average has also been much easier to tolerate when Crow-Armstrong is impersonating a video-game character.
Ben Brown has been the pitching staff's revelation, posting a 1.85 ERA and 0.94 WHIP over 68 innings while working both as a starter and reliever. Shota Imanaga has remained dependable with a 3.72 ERA and 1.10 WHIP.
The pitching depth also explains why the grade stops at A-. Jameson Taillon has a 5.92 ERA, Edward Cabrera is at 5.10 and Colin Rea is at 4.85. Chicago has an October-caliber lineup and several useful arms, but it also has enough rotation uncertainty to make every postseason off day feel medically necessary.
Crow-Armstrong's star turn and the lineup's depth support the high grade. The uneven rotation prevents the roster from joining Milwaukee at the top of the class.
Front-office grade: B+
Jed Hoyer has built a top-six team with a 95% probability of reaching October. That is successful.
It is also a reasonable expectation for an organization carrying an adjusted payroll of approximately $233.3 million, eighth-highest in baseball.
The Cubs are spending far more than any other team in the division. They are also fielding a very good team, which is preferable to spending far more than everyone else and fielding a bad one. Several organizations have conducted the necessary research.
Chicago deserves credit for developing a deep offense and constructing a roster that has remained comfortably in the playoff field. The grade stops at B+ because payroll changes the standard.
Producing a contender with baseball's eighth-highest payroll is a positive result. Producing a better contender with baseball's 19th-highest payroll is why Milwaukee keeps appearing in this article like an unwelcome control group.
Manager grade: A-
Chicago's .566 winning percentage is .046 higher than its .520 talent rating.
The positive scoring margin indicates that the record is not merely the product of favorable close-game outcomes. Craig Counsell has also kept Chicago comfortably inside the playoff field despite a division rival playing at a 101-win pace.
Counsell has not produced the same degree of overperformance as Murphy, but the Cubs have clearly exceeded the baseline implied by their .520 talent estimate.
Verdict: Chicago is good, deservedly headed toward October and capable of becoming dangerous in a short series.
The Cubs receive an A-. In most divisions, that might come with first place. Here it comes with Milwaukee six games ahead and refusing to participate in the normal rules of competitive balance.
Pittsburgh Pirates
Pittsburgh may be the most difficult team in the division to grade.
The Pirates are 55–52, but BBMI ranks them 10th in baseball and gives them a .527 talent rating, slightly higher than Chicago's. (BBMI's overall rank blends results with talent, so a team can rank behind a rival it out-rates on paper, which is exactly Pittsburgh's situation relative to the Cubs.)
Their underlying roster looks like a playoff team. Their accumulated record looks like a team that has spent several months considering the possibility.
BBMI's simulations give Pittsburgh a 33% chance of reaching October and a 2.2% probability of reaching the World Series. The roster is good enough to matter, but the Pirates have left themselves considerable work over the final two months.
Players/roster grade: B+
The Pirates' roster looks much more convincing player by player than its 55–52 record suggests.
Bryan Reynolds has produced a .381 on-base percentage and an .835 OPS. Oneil Cruz owns an .822 OPS with 14 home runs and 21 stolen bases, while Ryan O'Hearn has delivered an .803 OPS and 68 RBIs. Brandon Lowe has added 21 homers and 67 RBIs, and Nick Gonzales is batting .315.
Then there is Esmerlyn Valdez, who has hit 14 home runs in only 38 games while producing a 1.088 OPS. That pace is probably not sustainable unless Pittsburgh quietly acquired the first player in baseball history to peak at roughly 60 home runs per 162 games. Even after the appropriate small-sample disclaimer, it has been a remarkable arrival.
Paul Skenes has a 3.65 ERA, 149 strikeouts and a 1.06 WHIP across 120⅔ innings. Those numbers are not quite as extraterrestrial as some of his earlier work, but they remain front-line production. Carmen Mlodzinski has contributed a 3.36 ERA across 88⅓ flexible innings, and Gregory Soto has 13 saves with a 1.05 WHIP.
The grade stops at B+ because the roster also contains several significant disappointments. Marcell Ozuna has a .611 OPS, Henry Davis is at .603 and Mitch Keller has a 4.83 ERA.
The individual talent supports BBMI's top-10 rating. The inconsistency explains why that talent has not yet produced a secure playoff position.
Front-office grade: A-
Ben Cherington has finally assembled a roster capable of competing in the present rather than only appearing on lists of teams that could become interesting in 2028.
Pittsburgh's adjusted payroll is approximately $102 million, 23rd in MLB. BBMI ranks the Pirates 10th in talent and overall team strength. That gap between financial investment and roster quality is one of the strongest efficiency results in the division.
The front office has supplemented its young core with credible major-league talent instead of continuing to treat every season as an extended prospect orientation.
This is not an A- for Cherington's entire tenure. It is an A- for the talent assembled and resources used in 2026.
The grade stops short of an A because the team reaches the postseason in only one-third of BBMI's simulations. A front office is ultimately responsible for more than producing encouraging spreadsheets, even on this website.
Manager grade: B-
Don Kelly has the Pirates above .500 and playing meaningful games entering August. That qualifies as progress.
The quantitative case is less favorable. Pittsburgh's .514 winning percentage is .013 below its .527 talent rating, the only negative gap in the division. The margin is small, but the strong offense, pitching and scoring margin suggest that the roster has been capable of producing more than a 55–52 record.
Kelly deserves credit for maintaining stability. He does not yet deserve a high grade for maximizing the roster.
Verdict: Pittsburgh has built an inexpensive and legitimately talented team.
The front office and players receive favorable grades. The overall grade remains B- because a 33% playoff probability would be a disappointing outcome for a top-10 roster, even if Pirates fans have been trained to greet competitive baseball with cautious suspicion.
St. Louis Cardinals
St. Louis demonstrates why one grade cannot adequately describe an entire organization.
The Cardinals are 53–53, 21st in BBMI and projected to finish 78–84. They reach the postseason in only 13% of BBMI's simulations.
Those are mediocre overall results.
At the same time, their .500 record is meaningfully better than their roster's .452 talent rating. The Cardinals are not particularly good, but they have been better than they probably should be, which is the foundation of several respectable Midwestern compliments.
Players/roster grade: C
Jordan Walker has delivered the breakout season St. Louis spent several years assuring everyone was eventually coming.
Walker is batting .285 with 22 home runs, 77 RBIs, 14 stolen bases and an .856 OPS. Alec Burleson has also been excellent, batting .286 with 15 homers, 71 RBIs and an .812 OPS. Rookie JJ Wetherholt has added 15 home runs, 11 steals and a .348 on-base percentage, providing evidence that the organization's next competitive core may be more than a PowerPoint presentation.
Michael McGreevy has been the pitching bright spot with a 3.07 ERA and 1.13 WHIP across 114⅓ innings. Andre Pallante is 11–6 with a 3.77 ERA, while Kyle Leahy has provided a 3.55 ERA in 20 starts.
The problem is what happens after the bright spots.
Nolan Gorman has a .597 OPS, Pedro Pagés is at .575 and Nathan Church sits at .627. Matthew Liberatore has a 5.26 ERA, while Dustin May has posted a 4.59 mark.
Walker deserves an A. Unfortunately for St. Louis, roster grades are not issued to one right fielder and 25 supporting witnesses.
The Cardinals have several legitimate building blocks, but their thin lineup and ordinary rotation explain BBMI's .452 talent rating. The roster has performed well enough to remain respectable, not well enough to become a serious contender.
Front-office grade: B-
Chaim Bloom entered 2026 overseeing a transition toward a younger roster and a rebuilt player-development system.
St. Louis carries an adjusted payroll of approximately $94.6 million, 27th in MLB. Remaining near .500 with that level of spending is respectable, although reducing payroll is easier than constructing the next great Cardinals team.
The front office receives credit for establishing a coherent direction, giving younger players meaningful roles and keeping the major-league team competitive during the transition.
It does not receive a full B because the talent base has not improved enough to support a serious contender. The plan may be sensible. The finished product remains mostly theoretical.
Manager grade: A-
Oliver Marmol has one of the strongest managerial cases in the division.
St. Louis's .500 winning percentage is .048 higher than its .452 talent rating. Only Murphy's Brewers have produced a larger positive gap between actual winning percentage and BBMI talent.
The Cardinals' slightly negative scoring margin prevents the grade from reaching an A. Their record is better than their talent, but the underlying run production does not suggest that they are a hidden powerhouse.
Still, Marmol has kept an inexpensive, transitional roster competitive while the organization changes direction. He has effectively taken a roster projected below .500 and guided it to exactly .500, a sentence that sounds less impressive until the roster is examined.
Verdict: The Cardinals are not having an A-level season, but Marmol may be doing A-level work.
The C+ overall grade reflects a team outperforming limited talent without possessing enough quality to become a likely playoff participant.
Cincinnati Reds
Cincinnati entered the season trying to build on a playoff appearance.
By late July, the Reds were 49–55, last in the division and carrying a 1% probability of returning to October.
The model is technically not saying the season is over. It is saying Cincinnati should avoid making nonrefundable October reservations.
Players/roster grade: D+
Cincinnati's low roster grade is not an indictment of every player. Several members of the team have performed extremely well.
The issue is that there are not nearly enough of them.
Elly De La Cruz is batting .278 with an .860 OPS, 18 home runs, four triples and 18 stolen bases. Sal Stewart has added 21 homers and 76 RBIs, while JJ Bleday has contributed 17 home runs and an .812 OPS. Those three have provided Cincinnati with a credible middle of the order.
Chase Burns has been even better on the mound. The 23-year-old is 12–1 with a 2.42 ERA, 124 strikeouts in 107⅔ innings and a .204 opponent batting average. He has pitched like the ace of a contender, an awkward development for a club with a 1% playoff probability.
Unfortunately, the rest of the roster has produced enough counterevidence to fill an appeal hearing.
Matt McLain is batting .190 with a .621 OPS. Eugenio Suárez has a .682 OPS, Noelvi Marte is at .599 and TJ Friedl has managed a .515 mark. Cincinnati has received star-level production from De La Cruz and Burns while receiving something considerably less from several players expected to form the supporting cast.
The rotation behind Burns has also struggled. Rhett Lowder owns a 5.61 ERA, Brady Singer is at 4.53 and Nick Lodolo is at 4.60. Hunter Greene has a 7.06 ERA in four starts after missing substantial time, although his limited workload makes that figure more injury footnote than final judgment.
The Reds have a few excellent individual report cards and far too many requests for extra credit. De La Cruz, Stewart and Burns preserve the D+. The lack of production around them explains why the roster as a whole cannot receive anything higher.
Front-office grade: D
The comparison with Milwaukee is devastating.
Cincinnati's adjusted payroll is approximately $134.5 million. Milwaukee's is approximately $135.7 million.
The two organizations are separated by barely $1 million in adjusted payroll. They are separated by 22 places in BBMI's rankings, 16 games in the standings and approximately one functional organizational model.
That is not primarily a market-size difference. It is a roster-construction difference.
The Reds still have young players around whom a better roster can be built. That protects the front office from an F.
But a team with nearly the same payroll as Milwaukee, the division's lowest talent rating and a 1% playoff probability has badly underperformed its available resources.
Manager grade: B-
Terry Francona is not the primary cause of Cincinnati's disappointing season.
Cincinnati's .471 winning percentage is .022 higher than its .449 talent rating. The team has therefore won slightly more often than the quality of its full-strength roster would suggest.
The scoring margin complicates the argument. Cincinnati's minus-0.63 average margin is substantially worse than its record, indicating that some of the apparent overperformance may be the result of when the Reds have scored and allowed their runs.
There is also a ceiling on the grade for a manager whose team is six games below .500 and poor in nearly every underlying category.
Verdict: Cincinnati's roster has been inadequate, and the front office failed to solve obvious weaknesses after a playoff season.
Francona has probably extracted slightly more from the team than its talent warrants. Unfortunately, slightly more than inadequate remains inadequate.
Final NL Central report cards
| Team | Overall | Players/roster | Front office | Manager |
|---|---|---|---|---|
| Milwaukee Brewers | A+ | A | A+ | A+ |
| Chicago Cubs | A- | A- | B+ | A- |
| Pittsburgh Pirates | B- | B+ | A- | B- |
| St. Louis Cardinals | C+ | C | B- | A- |
| Cincinnati Reds | D | D+ | D | B- |
The division’s biggest lesson
The NL Central demonstrates why record, talent and organizational performance should not be treated as interchangeable.
Milwaukee has the division's best record and best roster, but it also has the strongest combination of player development, payroll efficiency and talent conversion.
Chicago has built a legitimate contender, although its financial investment makes that success less remarkable.
Pittsburgh has created more talent than its record and playoff position currently reflect.
St. Louis has produced a better record than its rebuilding roster should reasonably support.
Cincinnati has spent almost exactly what Milwaukee has spent and built a dramatically inferior team.
That is why the Brewers receive the division’s only overall A+.
Milwaukee is not merely ahead in the standings. The rest of the NL Central is chasing the way the entire organization operates.
Some are considerably farther behind than others.
Sources
Team records, BBMI rankings, talent ratings, playoff, division and World Series probabilities, and scoring margins: BBMI July 27 power rankings and July 28 postseason simulation (MLB Power Rankings, MLB Playoff Odds & Bracket Pulse). Player hitting and pitching statistics: MLB.com 2026 team stat leaders (Brewers, Cubs, Pirates, Cardinals, Reds). Payroll figures: Spotrac 2026 payrolls (Milwaukee, Chicago), with the Dodgers’ luxury-tax payroll (Spotrac) and Marshall Islands GDP included for comparison.
Disclosure: analytical and educational content about model performance. Not betting advice. Rankings, predictions, and probabilities are model outputs, not financial or betting advice, and past performance does not guarantee future results.
Continue the series: Division Report Cards
Grading the AL East: Tampa Bay Is Doing Rays Things Again
BBMI grades every AL East team on season, roster, front office and manager before the deadline. Tampa Bay earns the division's only A+ on baseball's 28th-highest payroll, while Toronto spends nearly three times as much for last place.
Rays A+ on the 28th payroll · Yankees A · Blue Jays D at the 5th-highest spendMLB · Division Report CardsGrading the NL East: Atlanta Wins, Washington Confounds, the Mets Invent Luxury Failure
BBMI grades every NL East team's 2026 season, roster, front office and manager before the deadline. Atlanta earns an A, Washington overachieves a weak roster, and the Mets spend $376M to become the division's worst team.
Braves A · Nationals overachieve a weak roster · Mets F on a $376M payrollMLB · Division Report CardsGrading the NL West: The Dodgers Bought Excellence, Which Beats Buying Failure
BBMI grades every NL West team's 2026 season, roster, front office and manager before the deadline. The Dodgers earn an A+ superteam grade; San Francisco pays $232M to sit near the bottom.
Dodgers A+ superteam · Giants D- · Rockies F on baseball's weakest rosterMLB · Division Report CardsGrading the AL West: Texas Leads Because Someone Eventually Had To
BBMI grades every AL West team's 2026 season, roster, front office and manager before the deadline. Texas leads a muddled division; Houston and Seattle have the talent but losing records; the Angels bottom out.
Rangers B lead a muddle · Astros and Mariners: talent, losing records · Angels FMLB · Division Report CardsGrading the AL Central: The White Sox Have Become the Responsible Adult
BBMI grades every AL Central team's 2026 season, roster, front office and manager before the deadline. The White Sox and Guardians lead on bottom-five payrolls while Detroit's expensive, talented roster sits fourth.
White Sox A- on the 26th payroll · Guardians A- · Tigers D+ with the top talentRelated research
Chicks Dig the Long Ball. The Brewers Don’t. Both Things Are Fine, Until October.
Milwaukee is fourth in baseball in runs and 27th in home runs. Over six months that’s a feature — a contact-and-speed offense that just keeps scoring. For one month every fall, it’s the exact flaw that keeps sending them home.
4th in runs · 27th in HR · −16% October scoringAnalysisThe Brewers pitching machine: how a small-market team manufactures aces
A bottom-third-payroll team has fielded one of baseball's best pitching staffs for the better part of a decade — by taking arms nobody else wanted and unlocking ones nobody else had. The numbers behind the turnarounds.
Burnes 3.12 → 0.38 HR/9 · Misiorowski 104.5 mph · ~$1.5M per winMLB · Postseason SimulationDodgers vs. Brewers: Where an October Series Would Turn
Milwaukee and Los Angeles have the National League's two best records, and BBMI has them meeting in 30.7% of simulated postseasons. If they do, the Dodgers win about 62% of the time — but the edge comes from the middle of the rotation, not the Game 1 aces.
Meet 30.7% · Dodgers 62% · 5.78 games · Milwaukee's opening is Game 5See it live
This is the “we show our work” side. The Prediction Record is the other half — every call locked before the game and graded in public.